America Reached 79 Years: What the Life-Expectancy Record Really Means
The United States set a life-expectancy record in 2024. The causes of the gain show why no single drug, industry, or political theory can claim the result.
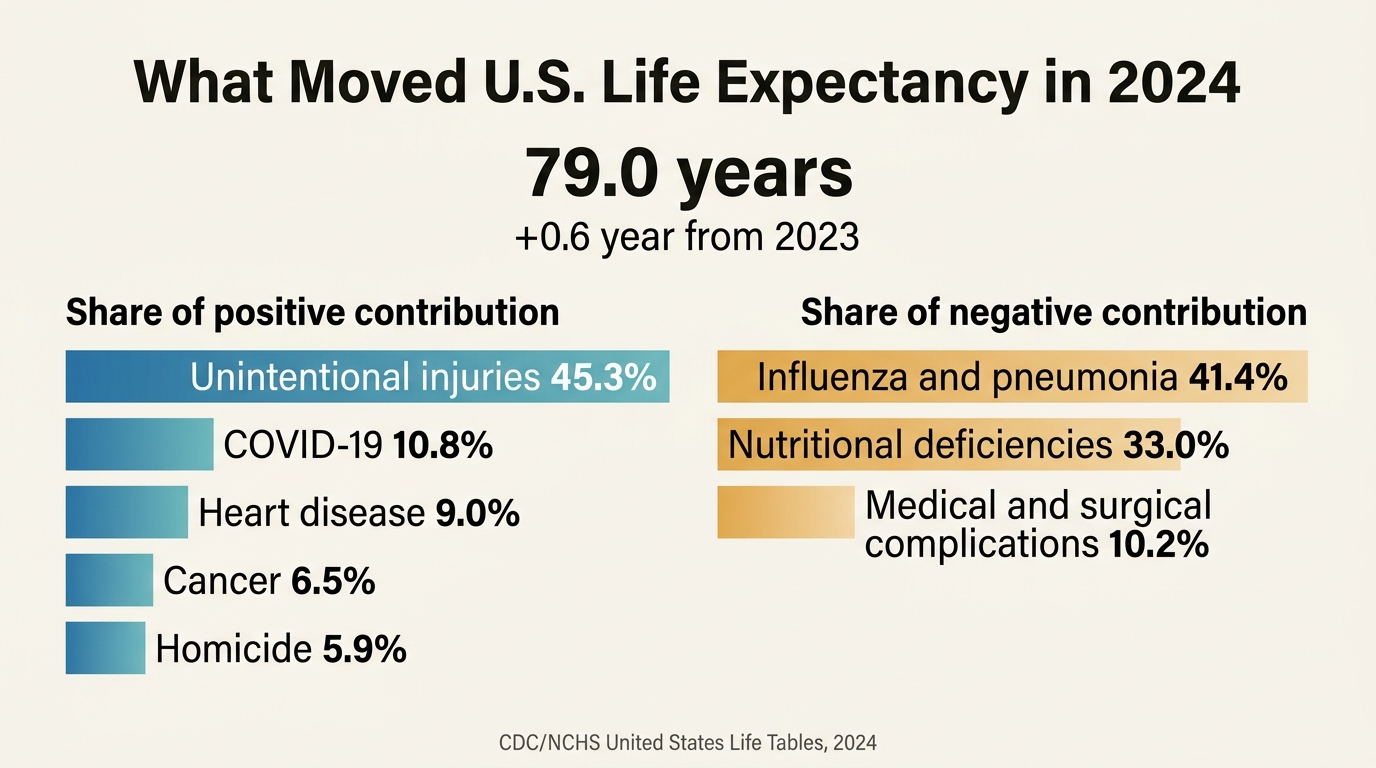
In 2024, 3,072,666 Americans died. That was 18,298 fewer deaths than in 2023, even as the population grew and aged. The age-adjusted death rate fell 3.8%, and life expectancy at birth rose from 78.4 to a record 79.0 years. The half-year gain is real. Its composition is more revealing than the record itself.
The federal life tables show which deaths stopped happening. Lower mortality from unintentional injuries supplied 45.3% of the positive contribution to the increase. Lower COVID-19 mortality supplied 10.8%, heart disease 9.0%, cancer 6.5%, and homicide 5.9% (National Center for Health Statistics, 2026a). The largest immediate force was not a new cancer drug or an obesity treatment. It was a sharp reduction in deaths that often occur decades before old age, especially drug overdoses.
A recent Wall Street Journal editorial framed the record as evidence for capitalism and pharmaceutical innovation. Biomedical markets deserve substantial credit for converting science into treatments at scale. The mortality data support a broader account. Medicines, diagnostics, emergency care, tobacco control, vaccination, harm reduction, safer behavior, public financing, and access systems accumulated into the result. A death certificate identifies the underlying cause of one death. It cannot allocate credit among the scientist, company, regulator, clinician, insurer, public program, and patient that determined the outcome.
Core finding: 79.0 years is both a genuine national record and a period estimate built from 2024 mortality rates. It measures current conditions. It does not predict the lifespan of a baby born in 2024.
What The Number 79 Measures
Life expectancy at birth is a period measure. It applies the age-specific death rates observed in 2024 to a hypothetical population for its entire life. Future medicine, epidemics, violence, behavior, and economic conditions will change those rates. The statistic remains useful because it compresses mortality across every age into one comparable number.
The same life table provides more intuitive measures. Under 2024 mortality conditions, 84.1% of a hypothetical cohort would survive to age 65, 59.0% to age 80, 43.8% to age 85, and 2.1% to age 100. A person who had already reached 65 could expect another 19.7 years, reaching 84.7 on average (National Center for Health Statistics, 2026a). Survival from birth and remaining life after reaching an older age answer different questions.
The record also marks the end of a national detour. U.S. life expectancy fell sharply during the pandemic and then increased for three consecutive years. In 2024, non-Hispanic Asian, Black, and White populations reached or surpassed their 2019 levels. Hispanic life expectancy remained 0.1 year below its 2019 value, and American Indian and Alaska Native life expectancy remained 0.7 year below it (National Center for Health Statistics, 2026a). The national recovery is complete by one aggregate measure, but not for every population.
The 2024 Mortality Ledger
The strongest gains appeared among younger adults. From 2023 to 2024, death rates fell 12.9% for people ages 15 to 24, 15.9% for ages 25 to 34, and 9.9% for ages 35 to 44. The declines were smaller but statistically significant in most older age groups (National Center for Health Statistics, 2026b). Preventing a death at 30 adds far more to life expectancy at birth than postponing a death at 90. Overdoses, homicide, and other causes concentrated at younger ages can move the national measure quickly.
Drug mortality changed at historic speed. The final overdose death rate fell 26.2% in 2024, from 31.3 to 23.1 deaths per 100,000. The country recorded 79,384 overdose deaths, and the rate involving synthetic opioids other than methadone fell 35.6% (National Center for Health Statistics, 2026c). Researchers still need to establish how much of the decline came from changes in the illicit fentanyl supply, wider naloxone availability, treatment, prevention, altered drug use, or other factors. The final national data establish the decline, not a single explanation for it.
COVID-19 moved in the same direction. Deaths for which COVID-19 was the underlying cause fell 37.1%, from 49,932 in 2023 to 31,426 in 2024. COVID-19 dropped from the tenth-leading underlying cause of death to fifteenth. That improvement reflects some combination of accumulated immunity, vaccination, antiviral treatment, clinical experience, and a changing virus. The mortality data cannot partition those effects.
Heart disease and cancer produced smaller percentage declines but remain large enough to affect the national result. Heart disease accounted for 683,491 deaths in 2024 and cancer for 619,876. Their age-adjusted death rates fell 2.8% and 1.7%, respectively. Unintentional-injury deaths dropped by 25,249, while raw heart-disease and cancer death counts rose slightly as the population aged. Age-adjusted rates estimate whether mortality risk changed after removing shifts in the population's age structure.
The ledger also contains losses. Increased deaths from influenza and pneumonia accounted for 41.4% of the negative contribution to the life-expectancy change. Nutritional deficiencies accounted for 33.0%, and complications of medical and surgical care for 10.2% (National Center for Health Statistics, 2026a). A national record does not mean that every cause improved.
Where Medicine Deserves Credit
The long decline in cardiovascular mortality came from prevention and treatment together. A modeling study of U.S. adults estimated that there were about 308,900 fewer coronary heart disease deaths in 2000 than there would have been under 1980 rates. Treatment accounted for about 1.09 million life-years gained, while changes in population risk factors accounted for about 2.06 million. Lower smoking, cholesterol, blood pressure, and physical inactivity produced large gains, partly offset by rising obesity and diabetes (Capewell et al., 2009).
Statins save lives, as do antihypertensive drugs, rapid treatment of heart attacks, surgery, and better management after a cardiac event. Their population effect depends on diagnosis, access, adherence, and risk-factor control. In a related analysis, statins accounted for an estimated 16,580 fewer coronary deaths between 1980 and 2000, while broader declines in smoking, cholesterol, and blood pressure accounted for much more of the total change (Björck et al., 2010). LifeMeter's analysis of one-time CRISPR cholesterol treatment versus lifetime statins describes the same translation problem at the next technological frontier.
Cancer mortality shows the same interaction. The National Cancer Institute reports that overall cancer death rates declined steadily from 2001 through 2022. Reduced smoking prevented many lung cancers. Screening changed outcomes for selected cancers. Surgery, radiation, chemotherapy, targeted therapies, and immunotherapies improved survival after diagnosis. For non-small cell lung cancer, population-level mortality fell much faster than incidence from 2013 to 2016, while survival after diagnosis improved. Researchers attributed the additional change mainly to treatment advances, especially targeted therapies (Howlader et al., 2020).
GLP-1 medicines may become part of the next mortality chapter, but they cannot explain much of the 2024 national record. In the SELECT randomized trial, semaglutide reduced the combined risk of cardiovascular death, nonfatal heart attack, or nonfatal stroke among people with established cardiovascular disease and overweight or obesity but without diabetes (Lincoff et al., 2023). FDA approved a cardiovascular-risk-reduction indication for Wegovy in March 2024. A therapy approved for this use during the same year as the mortality observation had too little time and population penetration to generate a clearly measurable national life-expectancy effect.
Its future impact will depend on appropriate prescribing, sustained use, supply, price, insurance coverage, side effects, and whether benefits observed in trials carry into routine care. The article GLP-1 Drugs as Potential Longevity Agents examines why disease-risk reduction is a stronger current claim than broad human rejuvenation.
Innovation Is Necessary; Distribution Determines The Result
Markets can reward risky biomedical research, scale manufacturing, and finance trials that no public laboratory could conduct alone. Public institutions also supply basic science, grants, tax advantages, regulation, vaccination programs, insurance, and much of the demand that makes large therapeutic markets possible. Universities, nonprofit hospitals, public-health departments, employers, and households complete the chain. The national mortality result appears only when an effective intervention reaches the people who can benefit from it.
The American record looks less dominant when compared with peer countries. OECD data for 2023 put U.S. life expectancy at 78.4 years, 2.7 years below the OECD average, while U.S. health spending reached $14,885 per person and 17.2% of gross domestic product. The OECD reported higher U.S. preventable and treatable mortality than its member-country averages. The United States performed well on some measures, including 30-day mortality after heart attack and stroke, but poorly on avoidable hospital admissions, obesity, suicide, and life expectancy (OECD, 2025).
This combination is coherent. A country can lead in biotechnology and specialist care while losing life-years to overdoses, violence, road deaths, metabolic disease, unequal access, and fragmented primary care. High spending does not guarantee high population survival if effective care arrives late or social risks remain high. Pharmaceutical innovation can reduce mortality from a particular disease without resolving the broader sources of premature death.
The National Average Conceals Different Americas
Every major racial and ethnic population in the 2024 life tables gained life expectancy, but the levels remained far apart. Life expectancy was 85.8 years for non-Hispanic Asian people, 81.8 for Hispanic people, 78.9 for non-Hispanic White people, 74.8 for non-Hispanic Black people, and 71.1 for non-Hispanic American Indian and Alaska Native people. The span between the highest and lowest estimates was 14.7 years (National Center for Health Statistics, 2026a).
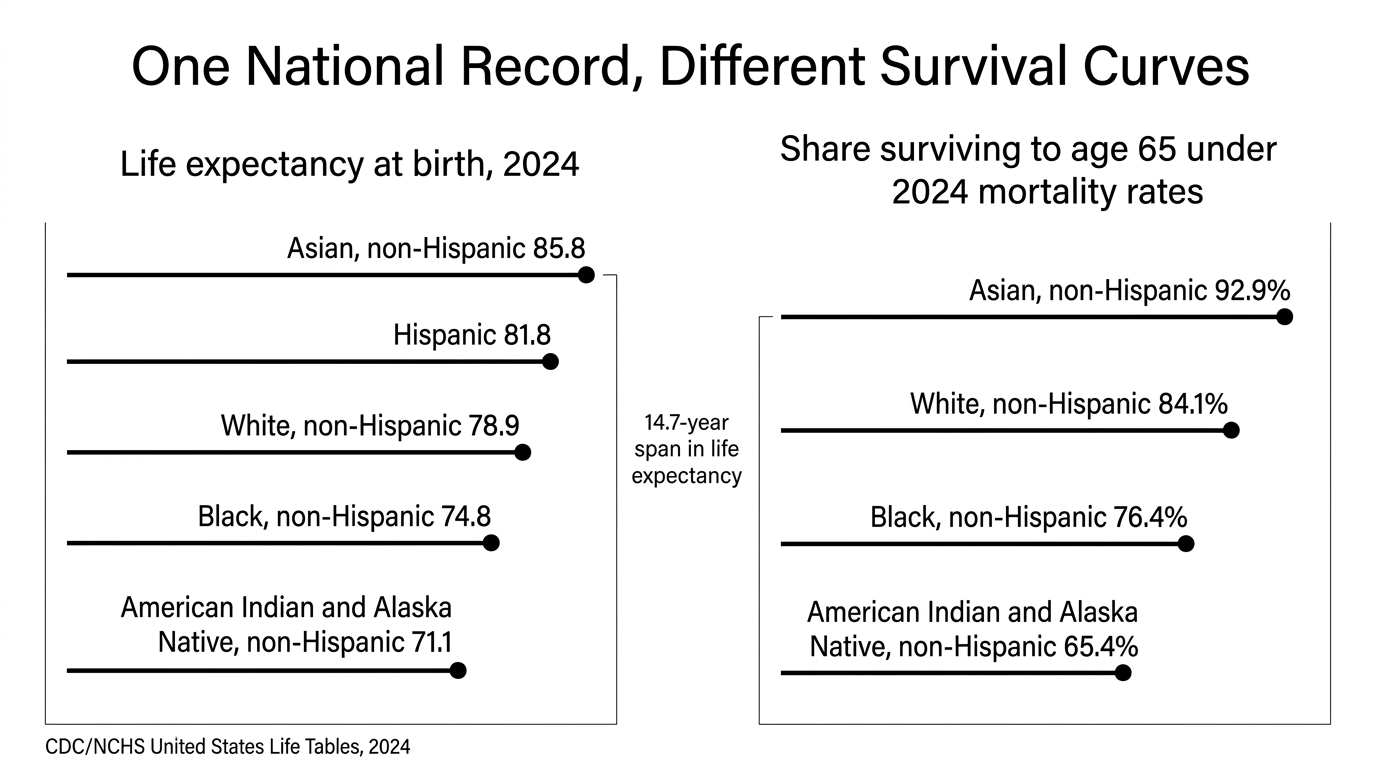
The survival gap is visible long before extreme old age. Under 2024 death rates, 92.9% of non-Hispanic Asian people in the hypothetical life-table cohort survived to 65, compared with 84.1% of non-Hispanic White people, 76.4% of non-Hispanic Black people, and 65.4% of non-Hispanic American Indian and Alaska Native people. Differences in exposure, geography, income, care, occupational risk, violence, addiction, and chronic disease accumulate across the life course. One national number cannot identify which mechanism dominates in a particular community.
The largest one-year gain occurred among American Indian and Alaska Native people, whose life expectancy rose by one year. That is material progress. Their life expectancy still remained the lowest of the groups reported and below its 2019 level. A rebound from a severe loss can produce a large annual increase without closing the underlying gap.
The Next Data Point Is Encouraging And Incomplete
Provisional 2025 data suggest that the improvement continued. The age-adjusted death rate fell another 4.6%, from 722.1 to 689.2 deaths per 100,000, the lowest rate recorded in the United States. Rates declined across every age group. The report covered 99.9% of death records received and processed by May 10, 2026, but the figures remain provisional. Injury deaths often arrive with longer reporting delays, and population estimates changed methodology between the two years (National Center for Health Statistics, 2026d).
The provisional report also shows why raw counts can mislead. Total deaths rose from 3.073 million in 2024 to 3.095 million in 2025, and deaths attributed to heart disease and cancer increased. Yet the age-adjusted death rate fell because the population was larger and older. Whether 2025 produces another increase in life expectancy will require final life tables, not inference from a single count.
Known, Inferred, And Unknown
| Category | Assessment |
|---|---|
| Known | U.S. life expectancy reached 79.0 years in 2024, up 0.6 year, and the age-adjusted death rate fell 3.8%. |
| Known | Lower unintentional-injury mortality supplied 45.3% of the positive contribution to the gain. The final overdose death rate fell 26.2%. |
| Known | Medical treatment and population risk-factor changes both contributed to long-run declines in cardiovascular and cancer mortality. |
| Inferred | GLP-1 use in 2024 was too recent and limited to explain a measurable share of the national life-expectancy record. |
| Unknown | The precise contribution of naloxone, addiction treatment, changes in fentanyl supply, behavior, and other factors to the overdose reversal. |
| Unknown | Whether the provisional 2025 mortality improvement will translate into another life-expectancy record after final data and life tables are released. |
What Would Make The Record Durable
The 2024 increase came partly from recovery: fewer COVID-19 deaths and a historic overdose decline after years of severe loss. Durable progress requires those gains to persist while chronic-disease mortality continues to fall. The highest-value work is visible in the data: prevent overdose relapse, reduce cardiovascular risk before the first event, extend effective cancer prevention and treatment, improve vaccination, and close large survival gaps across communities.
The research incentives that produce new drugs matter. So do the institutions that determine price, access, correct use, prevention, and trust. The useful test for any claimed longevity advance is concrete: Which cause of death does it change, at what ages, by how much, for which population, and after what delay? The 79-year record survives that test. It represents millions of individual outcomes moving in the right direction, but the causes of the gain are broader than any single industry or political theory.
Further Reading Inside The Site
This mortality-level analysis connects to One Injection vs Lifetime Statins, GLP-1 Drugs as Potential Longevity Agents, and Measuring ROI on Longevity Interventions. Together they separate clinical efficacy, population reach, and the time required for a treatment signal to become a survival outcome. Use the Country Systems Atlas to compare U.S. life expectancy with the infrastructure, access, logistics, and productive-capacity context of other countries.
Source List
National Center for Health Statistics. United States Life Tables, 2024. August 25, 2026.
National Center for Health Statistics. Mortality in the United States, 2024. January 29, 2026.
National Center for Health Statistics. Drug Overdose Deaths in the United States, 2023–2024. January 29, 2026.
National Center for Health Statistics. Mortality in the United States: Provisional Data, 2025. July 2, 2026.
Capewell S, Hayes DK, Ford ES, et al. Life-years gained among U.S. adults from modern treatments and changes in coronary risk factors between 1980 and 2000. American Journal of Epidemiology. 2009.
Björck L, Rosengren A, Bennett K, Lappas G, Capewell S. Coronary mortality declines in the U.S. between 1980 and 2000. American Journal of Preventive Medicine. 2010.
National Cancer Institute. Annual Report to the Nation on the Status of Cancer. 2024.
Howlader N, Forjaz G, Mooradian MJ, et al. The Effect of Advances in Lung-Cancer Treatment on Population Mortality. New England Journal of Medicine. 2020.
Lincoff AM, Brown-Frandsen K, Colhoun HM, et al. Semaglutide and Cardiovascular Outcomes in Obesity without Diabetes. New England Journal of Medicine. 2023.
U.S. Food and Drug Administration. FDA Approves First Treatment to Reduce Risk of Serious Heart Problems Specifically in Adults with Obesity or Overweight. March 8, 2024.
OECD. Health at a Glance 2025: United States. 2025.
The Wall Street Journal Editorial Board. You’re Living Longer, Americans. August 27, 2026.